


TI’s SimpleLink™ platform of connected MCUs continues to add capabilities to help customers optimize their development experience, recently adding Open On-Chip Debugger (OpenOCD) support for many SimpleLink devices and kits.
With built-in support for TI’s XDS110 JTAG debugging probe, the SimpleLink OpenOCD package natively supports most SimpleLink LaunchPad™ development kits and contains all required files based on the OpenOCD community mainline release.
In addition to the standard debugging and programming functions, OpenOCD offers advanced features to facilitate more automation and scripting as well as support for additional remote debugging applications.
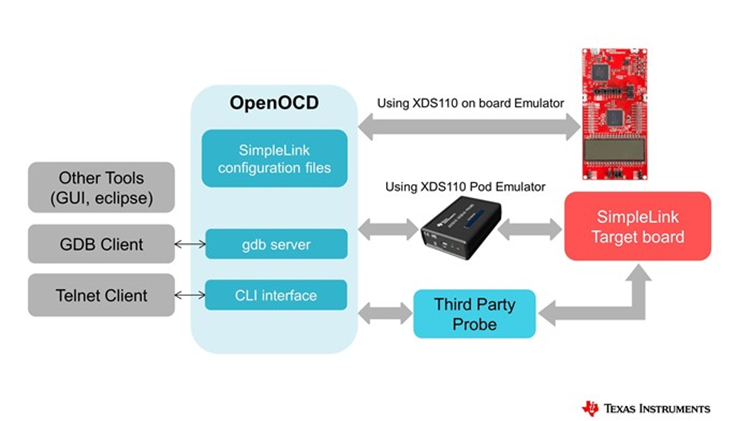
OpenOCD enables debugging through Telnet, GNU Debugger (GDB) or with Tool Command Language (TCL) scripts using Remote Procedure Call (RPC). The Telnet and GDB interfaces are controlled through human commands and the TCL interface is controlled through machine commands (see Figure 1).
GDB command-line debugging is one of the most popular industry tools for automating development without the need for an integrated development environment (IDE) and any associated overhead. GDB communication can be over Transmission Control Protocol/Internet Protocol (TCP/IP) or via pipes; many GDB command tutorials are available online.
With TCL scripting capability, you can develop with a high-level interface to OpenOCD and avoid writing more complex OpenOCD-specific commands. Scripts can help by addressing more complex bugs than what standard command-line tools can. TCL also offers an easy to build and use graphical user interface (GUI) for OpenOCD with minimal overhead. Telnet debugging also works with TCL commands and scripts.
OpenOCD is often combined with remote debugging environments, enabling the debugging of applications anytime and anywhere. This is very useful to support users across the globe or to debug devices that are not easy accessible. These environments are supported by the integration of three network interfaces: Telnet, GDB remote server and TCL server.
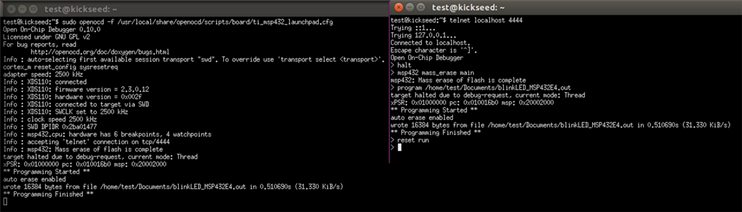
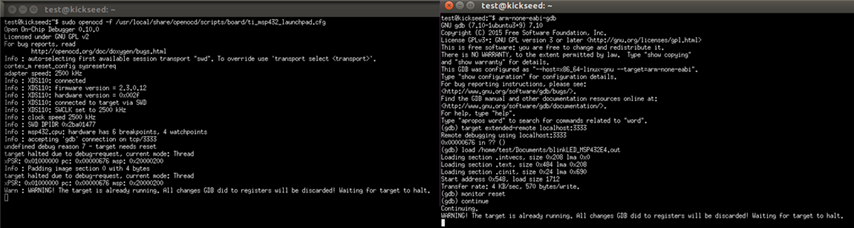
Moreover, you can use OpenOCD as a production programmer or for boundary scan testing. Programming can be accomplished through GDB or flash programming commands (see Figure 2 and Figure 3). With the help of TCL scripts, those flash commands program/verify/reset/shutdown) can easily implement the entire programming flow. With the same configuration, you can program different devices and architectures using different probes.
OpenOCD enables a closer debugging experience to data flows on the device and works with a panoply of open-source tools. OpenOCD is real-time operating system (RTOS)-aware, supporting Amazon FreeRTOS and other open-source kernels to facilitate the debugging of multithreaded applications. OpenOCD easily integrates with many Eclipse-based IDEs and those supporting GDB servers, like TI Code Composer Studio™ and IAR Embedded Workbench for Arm® devices. Similarly, to program SimpleLink devices, you can use any of the supported probes within OpenOCD like TI’s XDS110, Segger’s J-Link or any probe with Arm Cortex® Microcontroller Software Interface Standard (CMSIS) debug access port (DAP) support.


