


The demand for lithium-ion (Li-ion) batteries is growing at an exponential pace, fueled by the increasing popularity of electric vehicles, personal electronics and grid systems. As consumer demand grows, so does the need for highly accurate battery-formation testing capabilities.
Battery-formation testing requires multiple charge and discharge cycles; achieving high accuracy during this process is necessary to maximize battery life and storage capacity. The battery current and voltage must be precisely controlled through every cycle, with many manufacturers requiring greater than 0.05% full-scale control accuracy. Maintaining such high accuracy becomes more challenging as the battery current requirements increase, however.
TI’s Battery Tester Reference Design for High Current Applications leverages constant current (CC) and constant voltage (CV) calibration loops to achieve 0.01% full-scale charge and discharge current control accuracy. It supports charge and discharge rates as high as 50A and provides a modifiable platform for applications that need higher current or multiple phases. For example, the current specification of automotive cells is growing very sharply and may need even more than 50A.
As Figure 1 shows, the reference design features the LM5170-Q1, which regulates the current flowing into or out of the battery. The INA188 implements and monitors the CC control loop, and because the current might flow in either direction, the SN74LV4053A multiplexer can adjust the inputs of the INA188 accordingly. The sensed current is compared to a precision reference generated by the DAC80004 digital-to-analog converter (DAC), and both of these signals are fed into an error amplifier (EA) implemented with the TLV07. The output of the EA is fed back to the ISETA analog current programming pin of the LM5170, which regulates the current flowing through the current-sense resistor to the current reference signal.
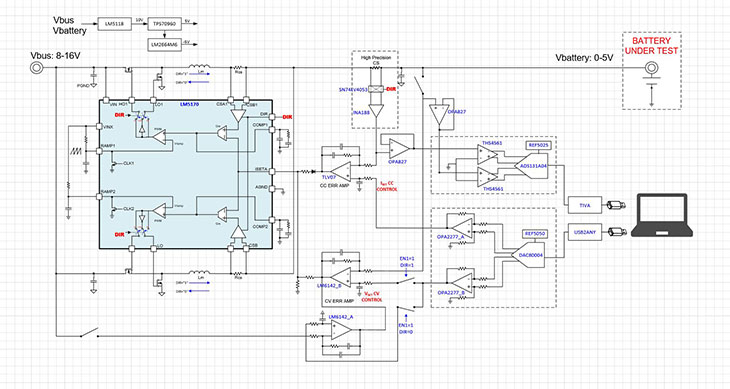
The CV control loop works in a similar fashion. The ADS131A04 (24-Bit, 128kSPS, 4-Ch, Simultaneous-Sampling Delta-Sigma Analog-to-Digital Converter (ADC)), monitors both battery voltage and current, and the DAC80004 sets a highly accurate voltage reference for the CV control loop. The ADC monitoring the voltage and current of the battery and has a simple graphical user interface (GUI) through which you can observe the status of the battery. The DAC also provides a GUI to set the reference signals for different applications.
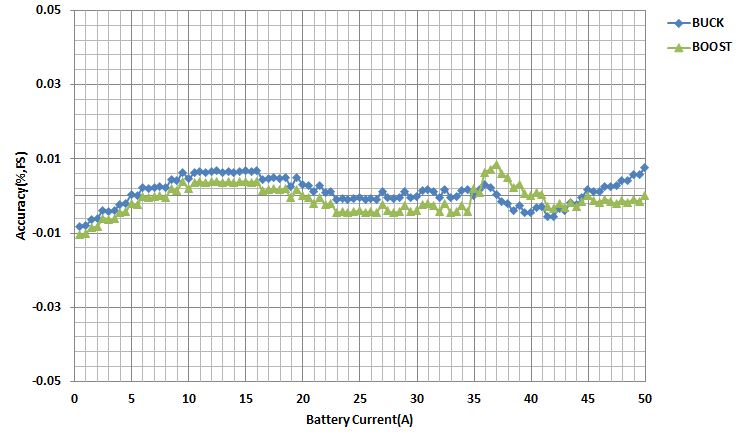
Many factors can affect system accuracy, including temperature drift, voltage drift and offset voltage. The battery tester reference design uses three-point calibration to account for different sources or any errors. Figure 2 shows the full-scale accuracy achieved over a wide current range. The system works at buck mode when charging the battery and at boost mode when discharging the battery.
After power on, the CV control loop outputs a high voltage to the battery because of the low battery voltage. This output signal causes the CC loop to take the control of the system first. As the voltage of the battery rises, the system gradually transitions from CC control to CV control when it reaches the reference voltage level.
Figure 3 shows the voltage control accuracy of the system with calibration when operating in buck mode.
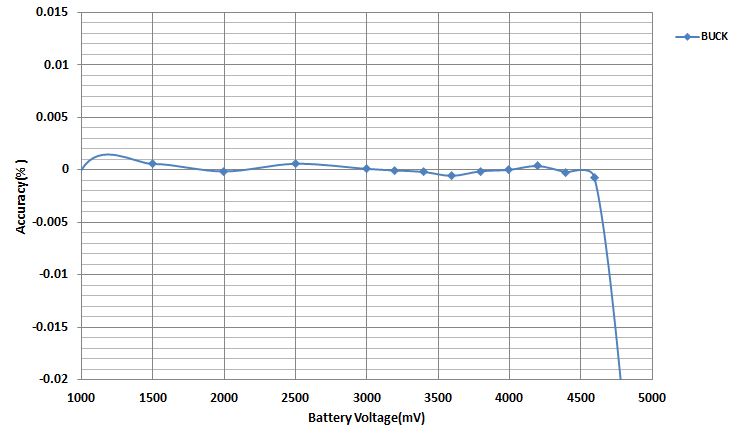
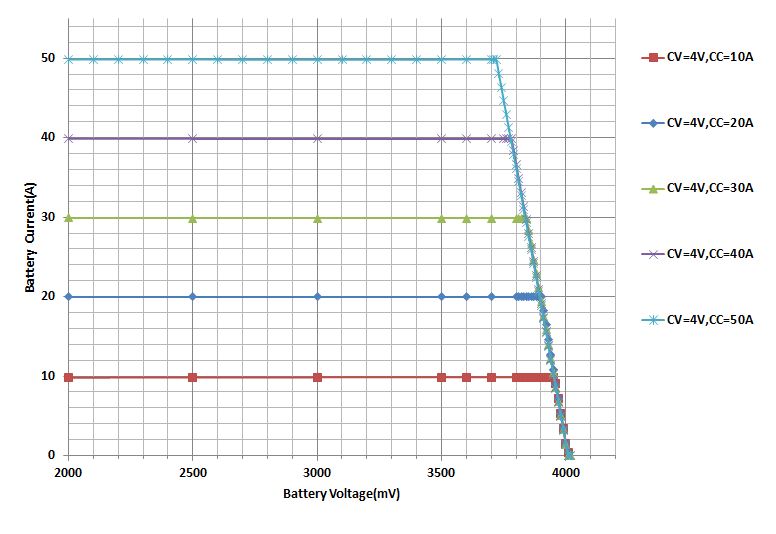
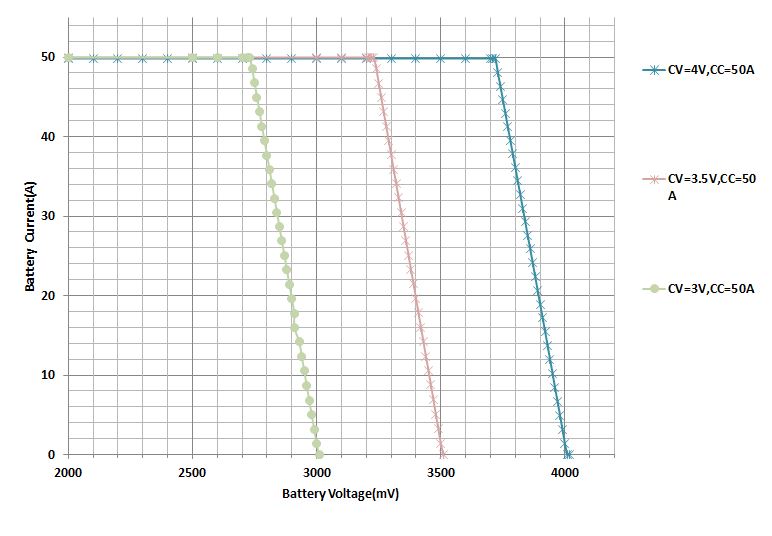
Figure 4 shows the transition curve under different current conditions with the same voltage setting. The transition point in Figure 4 is different for different conditions because the voltage drop on the power transmission path increases with the increase of the current setting. Figure 5 shows the transition curve under different voltage conditions with the same current setting. These two curves show a smooth transition from CC to CV, indicating that the control system is stable.
The reference design demonstrates how to achieve 0.01% full-scale charge and discharge current control accuracy leveraging CC and CV calibration loops, and it supports charge and discharge rates of up to 50A.
The article first appeared on Texas Instruments Blogs.

 Gets New Sequence Restart Mode for Automated Testing")


