


One of the disappointing but undeniable realities of today’s Internet age is that multi-vector distributed denial-of-service (DDoS) cyber-attacks are growing exponentially year-over-year. Moreover, DDoS threat vectors are also increasing in sophistication, leaving many enterprises unable to defend themselves. These two factors mean that defending against DDoS attacks not only requires scale and powerful tools, but also mandates the implementation of a flexible DDoS portfolio that can readily adapt and even predictably mitigate the majority of future DDoS threats.
As a result, enterprises are now increasingly entrusting vendors and communications service providers (CSPs) with the responsibility of protecting their networks from DDoS attacks, through the adoption of a DDoS managed services model. Consequently, the market for DDoS managed services represents a strong market opportunity for CSPs that can implement and deliver hosted DDoS services to enterprises of all sizes
However, the scope and market requirements for DDoS services are still evolving and quite fluid, even with respect to managed services pricing models. A detailed overview of a comprehensive model designed to quantify the financial and business case fundamentals of DDoS managed services and applications is shared below:
DDoS MODEL OVERVIEW
Because DDoS managed services are still being shaped by market forces, in creating the model a philosophy was adopted to afford the necessary and requisite levels of flexibility, the base model needed to be based on a bottom-up design that could support a broad range of sizing, enterprise types and pricing model attributes.
Therefore a model utilizing traditional, bottom-up approach incorporatingspecific estimates for the capital expenditure (capex), operational expenditure (opex) and other expenses, such as general sales and admin/marketing was built. The model also forecasts revenues for a number of DDoS service scenarios, incorporating pricing structures based on market pricing, DDoS service scope and related data usage and consumption profiles.
Once these attributes were defined, modeled and calculated, the next step is to assess short- and long-term financial viability by projecting net cash flows, the payback period for capex and finally, return on investment via calculation of net present value (NPV).
DDoS MANAGED SERVICE SCENARIOS
DDoS managed services cannot be delivered to enterprises using a “one size fits all” model, because enterprises differ on a number of levels – the most notable being size. For example, in most telecom markets, enterprises are broken into three sizes – small (1-50 employees), medium (50-250 employees) and large (more than 250 employees). In turn, this translates into enterprises that face a broad range of threat vectors, based on earnings potential and data sensitivity. As a result, enterprises require DDoS managed services that can address their vulnerabilities at affordable price points. While there are no definitive, agreed-upon industry benchmarks on the scope and capabilities of DDoS managed services, there are two representativescenarios ; the “On-Demand” and “Always-On” scenarios.
DDoS On-Demand Service Scenario
The DDoS On-Demand service scenario is a fully functional solution that delivers a strong measure of DDoS protection, it is designed as a baseline service, using a model in which selected data streams are monitored out of path – rather than monitoring every data flow in real time, which is the essence of an Always-On model.
To model the On-Demand scenario the methodology involves estimating the capex necessary to initially launch the service, as well as the additional infrastructure capex in a five-year window to support service growth.Thenthe opex is calculated which includes salaries of monitoring and operational staff (e.g., the staff of a security operations center), as well as additional “other” overhead costs related to selling the services in a five-year window.
These overhead expenses – traditionally referred to as selling, general and administrative (SGA) expenses – are broken out separately to provide clarity on production-related vs. non-production-related expense structures. For example, SGA expenses also include the marketing costs associated with launching an On-Demand service.
Model Output
Using the approach described above, capex, opex and SGA expenses and off-setting revenue, were calculated assuming a five-year ramp to achieve a 10 percent penetration of address-able market revenues by Year 5, based on number of enterprises, size, and DDoS-related bandwidth consumption.
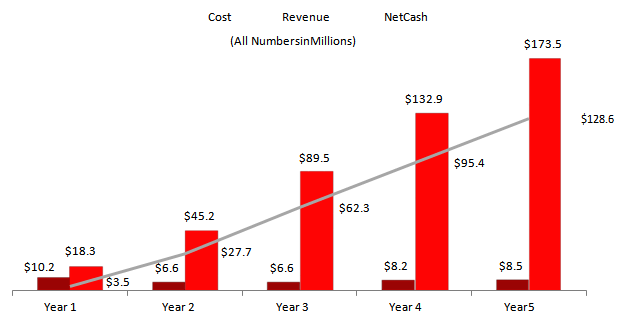
The results of this model, shown in Figure 1, reveal that considerable revenues can be achieved by supporting this service scenario. For example, while over this five-year period the investment (capex and opex, but not SGA expenses) adds up to $40.1 million, the off-setting revenue stream generates $459.3 million.
When SGA expenses are also added, a net revenue cash flow of $317.5 million is realized by Year 5. Even in Year 1, a positive cash flow of $3.5 million is achieved after covering the initial capex hit to deploy the infrastructure required for launch.
Figure 1: DDoS On-Demand Service Scenario – NPV Projection
| Year 1 | Year 2 | Year 3 | Year 4 | Year 5 | Total | |
| Cost | $10,213,893 | $6,641,522 | $6,641,522 | $8,198,774 | $8,455,383 | $40,151,093 |
| Revenue | $18,261,600 | $45,197,460 | $89,481,840 | $132,853,140 | $173,485,200 | $459,279,240 |
| Net Cash | $3,482,307 | $27,708,548 | $62,259,495 | $95,426,675 | $128,597,925 | $317,474,950 |
| NPV (5-Year) | $198,062,488 |
Financial Summary
The modeling of this scenario confirms that even a baseline solution such as an On-Demand scenario delivers very strong financial metrics, as witnessed by the ability to cover capex in Year 1 and generate a strong return of $317.5 million of net cash in a five-year window.
DDoS Always-On Service Scenario
In creating the Always-On DDoS service scenario, the goal is to capture the services andprotection levels that primarily medium and large enterprises require – particularly enterprises with valuable intellectual property, financial records or sensitive personal/ health records.
In many respects, this service is seen as delivering a premium level of DDoS protection because it analyzes all incoming data streams with real-time analytics, as opposed to the out-of-path sampling approach of the On-Demand model.Given the traffic and bandwidth requirements necessary to support it, this scenario supports a premium pricing model and is typically sold to a select number of larger enterprises.
Model Output
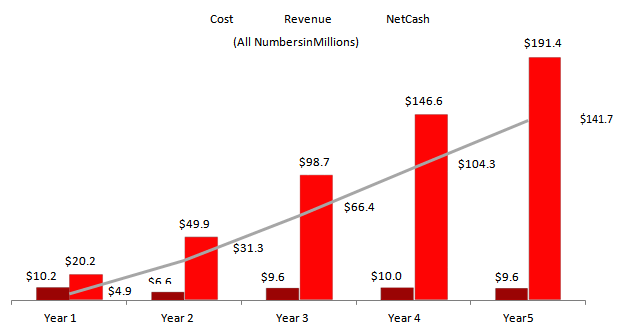
As the first DDoS scenario was done, similarly apex, opex and SGA expenses and off-setting revenue, were calculated assuming a five-year ramp to achieve a 10 percent penetration of address-able market revenues by Year 5, based on number of enterprises, size, and DDoS-related bandwidth consumption. The results of this model, shown in Figure 2, reveal that consider-able revenues can be achieved by supporting this service scenario.
For example, while over the five-year period the investment (capex and opex, but not SGA expenses) adds up to $46.1 million, the offsetting revenue stream generates $506.8 mil-lion. When SGA expenses are also added, a net revenue cash flow of $506.8 million is realized by Year 5. Even in Year 1, a positive cash flow of $4.9 million is achieved after covering the initial capex hit to deploy the infrastructure required for launch.
Overall, this model shows a five-year NPV of $239.4 million, assuming a discount rate of 10 percent. Similar to the On-Demand model, in Years 4 and 5, this model delivers impressive net profit margins of 71 percent and 74 percent, respectively.
Figure 2: DDoS Always-On Service Scenario – NPV Projection
| Year 1 | Year 2 | Year 3 | Year 4 | Year 5 | Total | |
| Cost | $10,213,893 | $6,641,522 | $9,627,723 | $10,012,636 | $9,554,770 | $46,050,544 |
| Revenue | $20,150,289 | $49,871,965 | $98,736,416 | $146,593,353 | $191,427,746 | $506,779,769 |
| Net Cash | $4,898,824 | $31,261,172 | $66,399,317 | $104,330,179 | $141,673,149 | $348,562,641 |
| NPV (5-Year) | $239,402,741 |
Financial Summary
The modeling of this scenario confirms that the Always-On service scenario delivers very strong financial metrics – even stronger than the On-Demand scenario – as witnessed by the ability to cover capex in Year 1 and generate substantial net cash of $348.6 million in a five-year window.
In Summary:
The rapid growth and complexity of DDoS attacks, coupled with cloud adoption, are fundamentally changing both security reference architectures and security service delivery models. While the industry, in general, is still responding on both fronts, its believed that the key to success will be to leverage the inherent scale, service agility and programmability traits of the cloud, and apply them to protect the interests of enterprise customers.
As a result, enterprises are increasingly interested in and receptive to the adoption of a managed DDoS service purchased from their CSP of choice. In turn, this is spurring progressive CSPs to expand their security services to include cloud-hosted DDoS solutions that meet the user demands of enterprises of all sizes.
APPENDIX: MODELING METHODOLOGY & ASSUMPTIONS
This appendix provides detailed supplementary information that has conservative and realistically achievable assumptions for commercial implementations.
Capex Estimates
Based on market sizing data provided below, a realistic net capex was derived based on list price, subject to a typically applicable 40 percent discount.
Below is thelist of net capex by year. The initial capex for service launch and additional capex for expansion in later years are both shown. The Always-On scenario evidently requires greater capital in the outer years, as data volumes start to scale.
Figure 3: Initial & Expansion Capex Estimates
| Scenario | Capex | Year 1 | Year 2 | Year 3 | Year 4 | Year 5 | Total |
| On-Demand | Initial | $3,572,371 | $0 | $0 | $0 | $0 | $3,572,371 |
| Expansion | $0 | $0 | $0 | $1,428,949 | $1,428,949 | $2,857,898 | |
| Always-On | Initial | $3,572,371 | $0 | $0 | $0 | $0 | $3,572,371 |
| Expansion | $0 | $0 | $2,857,897 | $2,857,897 | $2,143,423 | $7,859,217 |
Opex Estimates
In order to fully estimate opex, expenses were broken into two categories: salaries and software maintenance-related.
Salary-Related Opex Estimates
To approximate salary expenses in both scenarios, a “fully loaded” salary of $150,000 per employee per year was considered for a base of 40 employees. The number of employees was derived by informal discussions with other CSP employees. The results are shown below:
Figure 4: Salary Expenses
| Scenario | Year 1 | Year 2 | Year 3 | Year 4 | Year 5 | Total |
| Both Scenarios | $6,000,000 | $6,000,000 | $6,000,000 | $6,000,000 | $6,000,000 | $30,000,000 |
Software Maintenance Opex Estimates
The costs associated with the annual licensing of software maintenance, operational tools and dashboards were estimated based on actual commercial prices with any applicable discount applied. As shown in Figure 5, the net opex in both scenarios was relatively similar.
Figure 5: Software Maintenance Opex Estimates
| Scenario | Year 1 | Year 2 | Year 3 | Year 4 | Year 5 | Total |
| On-Demand | $641,522 | $641,522 | $641,522 | $769,826 | $1,026,434 | $3,720,825 |
| Always-On | $641,522 | $641,522 | $769,826 | $1,154,739 | $1,411,347 | $4,618,955 |
Revenue & Addressable Market Estimates
In order to address revenue potential, the first logical step is to define the addressable market based on some assumptions on enterprise size/footprint and bandwidth consumption patterns. As shown in Figure 6, the following breakdowns based on three enterprise types – small, medium and large – were used.
Figure 6: Enterprise Size & Connection Requirements (Both Scenarios)
| Enterprise Size | Number of Users | Connection Requirements per Month |
| Small | 1-50 | 50 Mbit/s |
| Medium | 50-250 | 500 Mbit/s |
| Large | More than 250 | 1,000 Mbit/s |
These baseline assumptions were then applied to the two scenarios. For example, the On-Demand scenario is ideally priced and sized for small and medium enterprises, and the Always-On scenario suited to medium and large enterprises. This means the addressable markets are different.
Moreover, as shown in Figure 7, pricing structures are very different. The Always-On scenario is a premium service, consumes much greater bandwidth & monitoring resources, and comes at a considerably higher price. The monthly pricing charges for both scenarios were estimated from informal discussions with CSPs that provided such services. These prices are representative of the pricing supported by markets.
A small ongoing discount year-over-year was also included (typically 1 to 5 percent per year) to reflect loyalty promotions. The resulting revenues calculated using this methodology are shown in the Revenue lines in Figures 1 and 2.
Figure 7: Enterprise Size Percentage & Pricing by Scenario
| Scenario | Percentage of Enterprise | Monthly Service Pricing | ||||
| Small | Medium | Large | Small | Medium | Large | |
| On-Demand | 82% | 16% | 2% | $237 | $1,667 | $1,916 |
| Always-On | 0% | 83% | 17% | $2,053 | $5,117 | $8,000 |
About Radware
Radware (NASDAQ: RDWR), is a global leader of application delivery and application security solutions for virtual, cloud and software defined data centers. Its award-winning solutions portfolio delivers service level assurance for business-critical applications, while maximizing IT efficiency. Radware’s solutions empower more than 10,000 enterprise and carrier customers worldwide to adapt to market challenges quickly, maintain business continuity and achieve maximum productivity while keeping costs down. For more information,Please visit www.radware.com.
By Nikhil Taneja
Managing Director-India, SAARC& Middle East


