


When developing distributed intelligence for smart power switches in automotive power management systems, it is crucial to ensure that the protection mechanisms are truly intelligent. This is especially critical in scenarios involving multi-channel drivers as even minor asymmetries or unexpected load conditions can impact protection effectiveness.
In automotive environments, smart drivers play a crucial role in managing and distributing power from the car’s battery to various components like ECUs, motors, lights, and sensors. These multi-channel drivers control different electrical loads, such as resistive, inductive, and capacitive actuators, in parallel. It is crucial to maintain a balanced current flow across all channels for the drivers to function correctly and ensure the vehicle operates effectively and efficiently. Any minor asymmetries in the layout that cause current focalization through specific metal paths as well as unexpected situations like damaged or faulty loads and improper wiring can cause high current density in small areas. This leads to overheating of the integrated circuits and heat focalization with hot spots, ultimately resulting in component failure and damage.
Although thermal simulations and preventive measures are implemented, verifying and validating the implementation of intelligent protection mechanisms is crucial to identify potential issues that can delay timely intervention.
Thermal Sensing in Smart Switches
Balanced current flow is essential for high-side drivers to effectively manage heat, as they are required to handle significant amounts of current in very small and compact packages. They are often located in enclosed areas with poor ventilation and thermal dissipation, making heat management even more crucial.
Therefore, intelligent performance should rely on embedded thermal diagnostics based on sensing and protection mechanisms which monitor the driver’s temperature and take action when it exceeds predefined thresholds. Temperature sensing is quite a difficult task as it is strongly affected by the uniformity of the current flow in the different sections of the driver across all channels to achieve accurate temperature readings.
Unexpected high current density areas or short-circuit conditions are a significant concern as they can cause unpredictable heat concentration through diffused hot spots which produce sudden temperature increases in a very short period of time. These conditions can lead to overheating and component failure, which can be dangerous and costly to repair.
To prevent damage caused by thermal stress, the protection circuit is designed to limit the current and keep the power MOSFET within the safe operating area (SOA) until the thermal shutdown is triggered, which turns off the driver. However, this type of protection can cause physical stress on the surface of the power device. The current limit needs to be set high to meet inrush requirements and process tolerances, resulting in a fast thermal rise on the die’s surface when driving into a shorted load. This sudden temperature fluctuation can create significant thermal gradients across the die’s surface, leading to thermo-mechanical stress that can affect the device’s reliability.
The VIPower M0-9 high-side drivers have addressed this issue by integrating two temperature sensors in the cold and hot zones, respectively (as shown in Fig. 1).
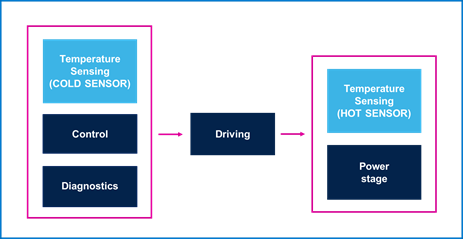
Fig. 1 Simplified block diagram of a smart switch with different temperature sensors.
The temperature sensors are implemented using polysilicon diodes thanks to their linear temperature coefficient across operating temperatures. The cold sensor is positioned in the cold zone of the driver near the controller, while the hot sensor is placed in the power stage area, which is the hottest zone in the driver.
Using this double sensor technique enables the driver’s temperature increase to be limited since the thermal protection is triggered when the lowest temperature value between the over-temperature threshold and a dynamic temperature level between the sensors is reached. Once removed the overtemperature fault, the smart switch can be reactivated when the temperature decreases to a fixed value.
This significantly helps to reduce thermal fatigue in terms of thermo-mechanical stress on the switch, which can accumulate over time and lead to degradation and reduced reliability.
Thermal Mapping
Along with simulation and prevention procedures, infrared (IR) thermography is a valuable technique to obtain detailed thermal maps of the driver, which provide a comprehensive understanding of the heat distribution within the integrated circuit, highlighting any potential hazard.
To assess the effectiveness of intelligent protections in harsh automotive applications, the heat distribution within the driver has to be analyzed under challenging short-circuit conditions with two different scenarios:
- Terminal Short-Circuit (TSC);
- Load Short-Circuit (LSC).
The terminal short-circuit condition occurs when a low resistance connection between the terminals of a component or device is present, as shown in Fig. 2
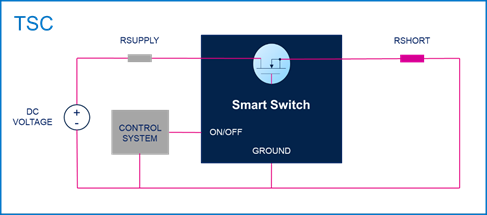
Fig. 2 Testing circuit for temperature measurement under TSC.
On the other hand, a load short-circuit condition arises when there is an inductive path between the load and the power source, leading to a sudden surge in current flow (Fig. 3)
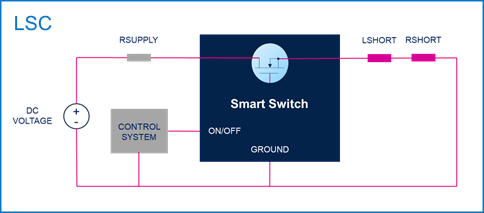
Fig. 3 Testing circuit for temperature measurement under LSC.
The following test conditions are considered:
- Tamb = 25 °C
- Vbat = 14 V
- Ton = 1 ms for mapping
- Ton = 300 ms for temperature acquisition of thermal sensors and hot spots
- TSC condition: RSUPPLY = 10 mΩ, RSHORT = 10 mΩ
- LSC condition: RSUPPLY = 10 mΩ, LSHORT = 5 µH, RSHORT = 100 mΩ
where Tamb is the ambient temperature
Vbat the DC battery voltage
Ton the time duration of the short-circuit event
RSUPPLY the resistance of the battery
RSHORT the short-circuit resistance
LSHORT the short-circuit inductance.
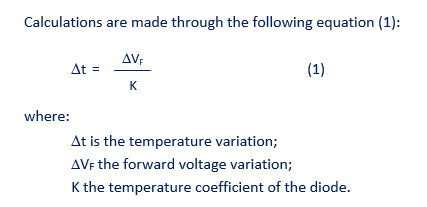
In order to generate a temperature map, the IR camera sensor is utilized to capture the infrared emissions at each location, which are then converted into temperature values. To ensure the conversion accuracy from specific colors to defined temperature values, a calibration process is essential. This process involves comparing the different colors obtained from the sensor with known temperature values, which can be obtained through specific thermal sensitive parameters and their trend versus temperature increase. By analyzing these parameters, the calibration process can ensure that the temperature map accurately reflects the temperature distribution in the area being scanned.
To calibrate the IR camera sensor, the forward voltage (VF) of the MOSFET’s body drain diode is chosen due to its linear dependence on temperature. However, a pre-calibration of the diode is necessary to accurately determine its temperature coefficient. This is achieved by measuring the VF voltage at a constant forward current (IF) while varying the temperature from 25°C to 100°C. To prevent any temperature rise caused by the current and its associated power dissipation, the IF value is selected within the range of 10mA to 20mA.
The VF values collected at different temperatures can be used to perform a linear interpolation and mathematical fitting to obtain the temperature coefficient of the diode, as shown in Fig. 4.
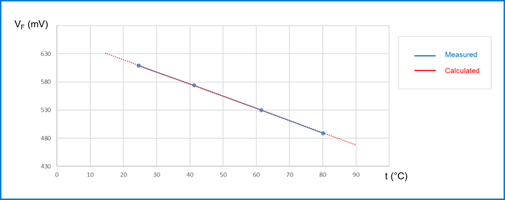
Fig. 4 Pre-calibration of MOSFET’s body drain diode.
The temperature map is created by acquiring each temperature point through an IR camera sensor at 1ms intervals. Once all the die points are acquired (which takes around 3000 seconds), a specialized software generates the map, which depicts the temperature of each point based on the minimum spatial resolution of the IR sensor. By overlaying the thermal map onto the row silicon die picture, it is possible to identify the hottest points in the active area and determine their coordinates while the current flows through the device.
As an example, the thermal maps for the dual-channel VND9012AJ smart switch are depicted in Fig. 5 under TSC conditions.
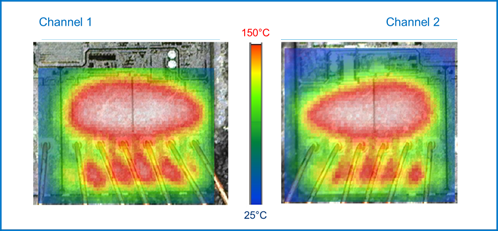
Fig. 5 Thermal maps for VND9012AJ channels under TSC condition.
The graphical representation of temperature distribution across the driver’s channels, depicted through varying colors within the temperature range of 25°C to 150°C, serves as a crucial aid in detecting any regions experiencing excessive heat and ensuring the driver’s safe temperature operation. The provision of thermal maps for each channel under diverse operating conditions enables the tests to authenticate the driver’s reliable functioning without surpassing its maximum temperature threshold.
In order to locate the hot spots and monitor the temperature evolution for both hot and cold sensors, and subsequently validate the efficacy of the thermal shutdown mechanism, a longer short-circuit duration of 300ms is taken into account.
The temperature variations observed in VND9012AJ while undergoing TSC are displayed in Fig. 6.
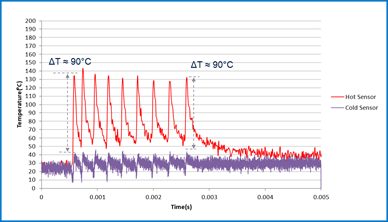
Fig. 6 Temperature variations for both sensors under TSC condition.
The graph indicates the presence of hot spots in both channels of VND9012AJ as detected by the hot sensors, and the maximum temperature of these hot spots is in the range of 150 °C.
The thermal maps for VND9012AJ under LSC conditions are presented in Fig. 7.
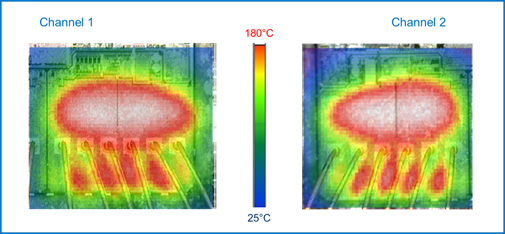
Fig. 7 Thermal maps for VND9012AJ channels under LSC condition.
The temperature variations observed in VND9012AJ while undergoing LSC are displayed in Fig. 8.
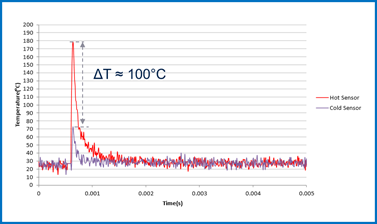
Fig. 8 Temperature variations for both sensors under LSC condition.
Both conditions trigger the thermal protection mechanism, causing the current to be limited to a safe level.
Conclusions
Valuable insights into the design and operation of the smart switch have been obtained through experimental results, particularly regarding current distribution and thermal protection mechanisms. It is essential to maintain a well-balanced behavior of all channels to create an intelligent driver that improves safety and reliability in automotive systems. The use of IR thermography enables a precise and comprehensive analysis of temperature distribution, which enhances the smart switch’s thermal sensing and protection system. In demanding automotive environments, swift activation of these protections is crucial to detect overheating and prevent any potential harm to the device or system.


