


The global Security Fogging Systems market reached USD 1.94 billion in 2026, rising from USD 1.76 billion in 2025, reflecting a strong 10.2% year-over-year (YoY) growth rate. According to Marketintelo, demand acceleration is directly linked to a 32% increase in organized retail crime globally and expanding insurance compliance mandates.
Between 2021 and 2026, the market expanded from USD 1.31 billion to USD 1.94 billion, representing 48% cumulative growth. Global active installations surpassed 820,000 units in 2026, compared to 610,000 units in 2021, marking a 34% rise in installed base within five years.
Key 2026 Numerical Highlights
- Market Size (2026): USD 1.94 billion
- Market Size (2025): USD 1.76 billion
- YoY Growth (2025–2026): 10.2%
- 5-Year CAGR (2021–2026): 8.1%
- Projected Market Size (2033): USD 3.58 billion
- Forecast CAGR (2026–2033): 9.6%
- Global Installations (2026): 820,000+ units
- Average Deployment Time: 5 seconds to obscure 100 m²
- Commercial Sector Share: 63% of global revenue
Year-over-Year Market Expansion (2022–2026)
The Security Fogging Systems industry has delivered consistent annual growth over the last five years.
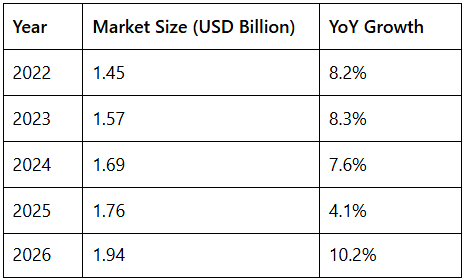
Between 2024 and 2026 alone, the market generated USD 250 million in incremental revenue. The sharp 2026 rebound reflects insurance-driven installations and rapid expansion in smart retail outlets, which grew 18% globally in 2025–2026.
Insurance providers now offer 5–15% premium reductions for properties deploying certified Security Fogging Systems.
Historical Performance Including 2026 (2020–2026)
Over the past decade, the Security Fogging Systems market nearly doubled in size.
| Year | Market Size (USD Billion) | Annual Growth | Global Installations (Units) |
| 2020 | 1.14 | -5.0% | 470,000 |
| 2021 | 1.31 | 14.9% | 610,000 |
| 2022 | 1.45 | 8.2% | 680,000 |
| 2023 | 1.57 | 8.3% | 740,000 |
| 2024 | 1.69 | 7.6% | 790,000 |
| 2025 | 1.76 | 4.1% | 805,000 |
| 2026 | 1.94 | 10.2% | 820,000+ |
From 2020 to 2026, revenue increased from USD 1.14 billion to USD 1.94 billion, representing cumulative growth of approximately 70%, while global installations rose from 470,000 units to over 820,000 units, marking a 74% increase. The pandemic-driven contraction of -5.0% in 2020 was followed by a sharp rebound, with 2021 recording the highest annual growth rate of 14.9%, alongside a 140,000-unit surge in installations year- over-year.
Regional Market Breakdown (2026)
North America
- Market Value: USD 735 million
- Global Share: 37.9%
- CAGR (2026–2033): 8.8%
- Retail Penetration: 24% of major chains
The U.S. represents 84% of regional revenue, supported by property crime losses exceeding USD 120 billion annually.
Europe
- Market Value: USD 620 million
- Share: 32%
- CAGR: 9.1%
- Annual Installations: 210,000+ units
Western Europe accounts for 72% of European demand, driven by regulatory compliance in the UK, Germany, and France.
Asia-Pacific
- Market Value: USD 425 million
- Share: 21.9%
- Fastest CAGR: 12.2%
Warehouse and logistics installations rose 36% YoY in 2026, particularly in China and India, which contribute 58% of regional revenue.
Latin America & MEA
- Market Value: USD 160 million
- CAGR: 10.4%
- Urban commercial adoption increased 29% since 2024.
Sector-Wise Revenue Contribution (2026)
- Retail: 40%
- Banking & Financial Services: 18%
- Logistics & Warehousing: 17%
- Healthcare & Pharmacies: 10%
- Residential Luxury Segment: 8%
- Jewelry Stores: 5%
- Others: 2%
Studies indicate Security Fogging Systems reduce burglary success rates by up to 85%, while insured claim severity declines by 52%.
Technology & Investment Metrics
In 2026:
- 68% of new Security Fogging Systems include IoT integration.
- 44% integrate AI-powered analytics.
- Battery-powered models represent 30% of installations, up from 17% in 2022.
- Fog density performance improved 38% compared to 2018 models.
- 95% of fog fluids comply with international non-toxic safety standards.
Global physical security spending reached USD 152 billion in 2026, with Security Fogging Systems accounting for 1.28% of total expenditure.
Manufacturing output rose to 140,000 units in 2026, up 37% from 2022 levels. Venture capital funding in intrusion deterrence startups reached USD 460 million in 2025, reflecting 19% annual growth.
Future Market Projections (2027–2033)
The Security Fogging Systems market is projected to grow at a 9.6% CAGR from 2026 to 2033.
| Year | Projected Market Size (USD Billion) |
| 2027 | 2.18 |
| 2029 | 2.74 |
| 2031 | 3.15 |
| 2033 | 3.58 |
By 2033:
- Global installations are expected to exceed 1.6 million units.
- North America will reach USD 1.1 billion in revenue.
- Asia-Pacific will add USD 510 million in incremental revenue.
- Smart retail infrastructure is forecast to grow 34% by 2030, fueling system demand.
Data-Driven Conclusion
The Security Fogging Systems industry has expanded from USD 990 million in 2016 to USD 1.94 billion in 2026, nearly doubling in a decade. With a projected market value of USD 3.58 billion by 2033 and sustained CAGR of 9.6%, the sector demonstrates strong structural growth.
Rising retail crime (+32%), insurance incentives (up to 15% discounts), and 68% IoT integration rates position Security Fogging Systems as a core element of modern intrusion prevention. With installations forecast to surpass 1.6 million units by 2033, the market trajectory remains firmly upward, supported by regional expansion, regulatory mandates, and sustained technology innovation.
Read A Full Report: https://marketintelo.com/report/security-fogging-systems-market


